This semester, GOVT372 “Political Communications in a Polarized Era” conducted a campus-wide survey to examine University students’ political perspectives, which addressed topics such as students’ positions on the Democratic primary field, knowledge of political issues, and overall partisan socialization. Fielded in mid-September, the class has been analyzing the data over the course of the semester.
Overall, the survey received 700 student responses, but included slightly more women and fewer students of color than the greater University population. Fifty-five percent of respondents identified as female, and 40 percent identified as male; 28 percent of respondents identified as students of color; and 15 percent were international students. Additionally, 44.7 percent of respondents identified themselves as a part of the upper-middle class, and the majority of students—33.4 and 33.3 percent, respectively—identified as from an urban or high-density suburban hometown.
For years, University students have joked about cultural and social differences between those who sit on the West Wing and Mink Dining Hall—Loud Side and Quiet Side, respectively—of the Usdan University Center’s dining hall. To investigate this perceived divide, the survey asked respondents “With which side of Usdan do you identify?” The class then compared these results to political perceptions and affiliations. According to the data, 48.7 percent of respondents identified as a part of the “Quiet Side,” 22.6 percent identified as a part of the “Loud Side,” 20.6 percent as identified as a part of both sides, and 8.1 percent as neither side.
One of the first questions on the survey asked what students saw as the most pressing issues currently facing the United States. According to the data, the majority of students are most concerned with the environment. This was followed by gun violence, and then race relations.
Students in GOVT372 then looked at these results in comparison to “Loud Side” and “Quiet Side” respondents. According to the data, students who identified as a part of the “Quiet Side” supported Senator Elizabeth Warren most strongly, followed by Senator Bernie Sanders. While “Loud Side” respondents also primarily supported Warren, their second favorite was equally divided between former Vice President Joe Biden and Sanders. Both received 15.7 percent of the “Loud Side” respondents’ support.
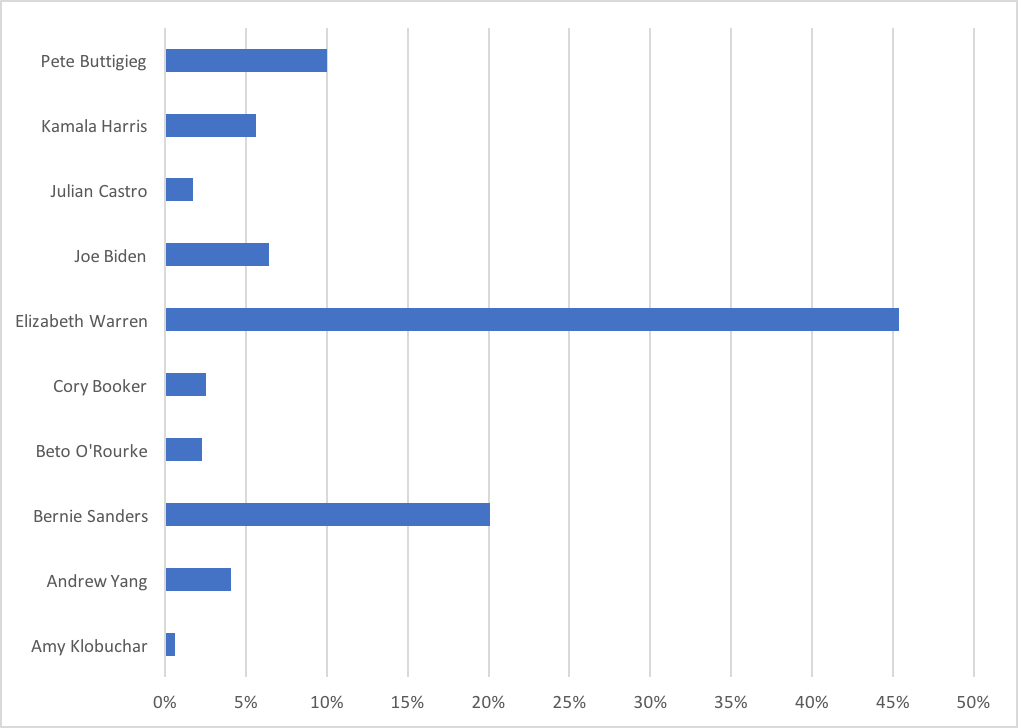
Figure 1. Total student response to the survey question about Democratic Party candidate preference.
Despite these results, the data show that the student body is also concerned with the notion of electability. When asked who had the best chance of beating President Donald Trump—regardless of who students individually support—respondents most heavily supported Biden, followed by Warren and then Sanders.
Another section of questions that the survey looked for was partisan socialization. When asked if students had any friends on the opposing side of the political spectrum, 54.5 percent of students said no. When broken down by geography, urban students were by far the least likely to be friends with political opponents. High-density suburban, low-density suburban, and rural students, on the other hand, were more likely to be friends with people from the other side of the political spectrum.
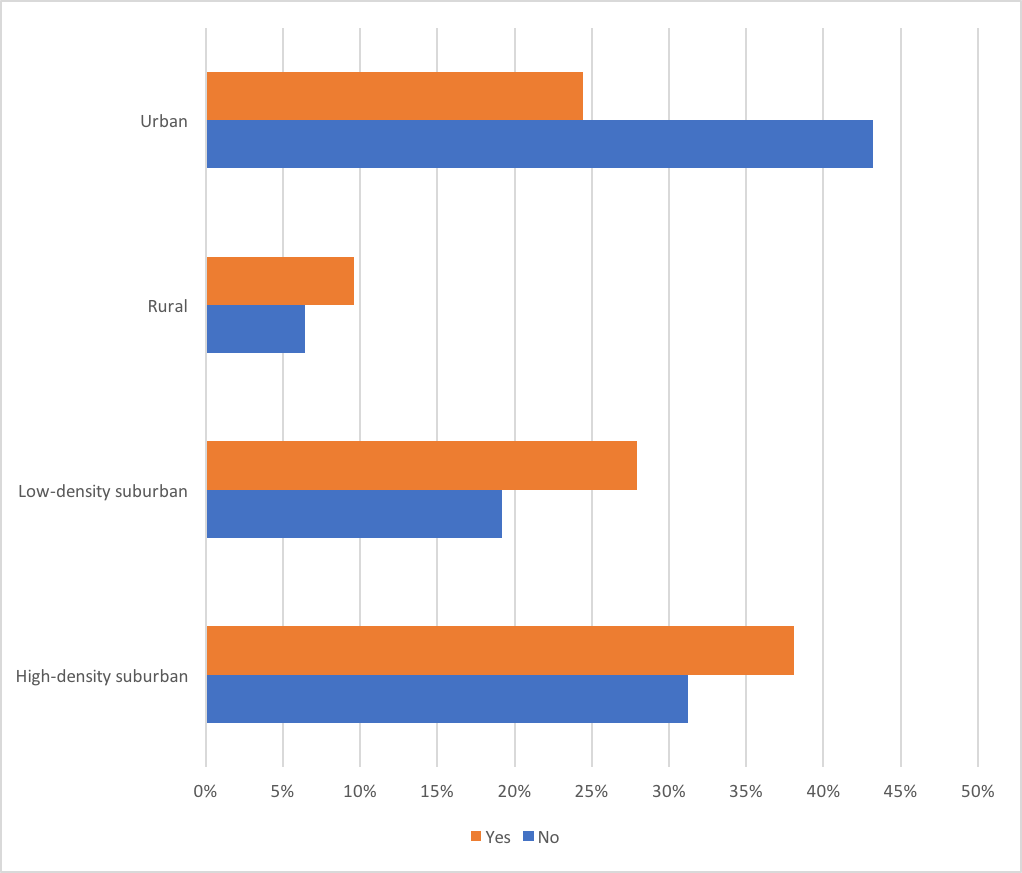
Figure 2. Distribution of partisan socialization, as moderated by students’ hometowns
The class also compared these results to “Loud Side” and “Quiet Side” respondents. According to the data, students who identified as a part of the “Quiet Side” were the least likely to be friends with political opponents, whereas students on the “Loud Side” were the most likely.
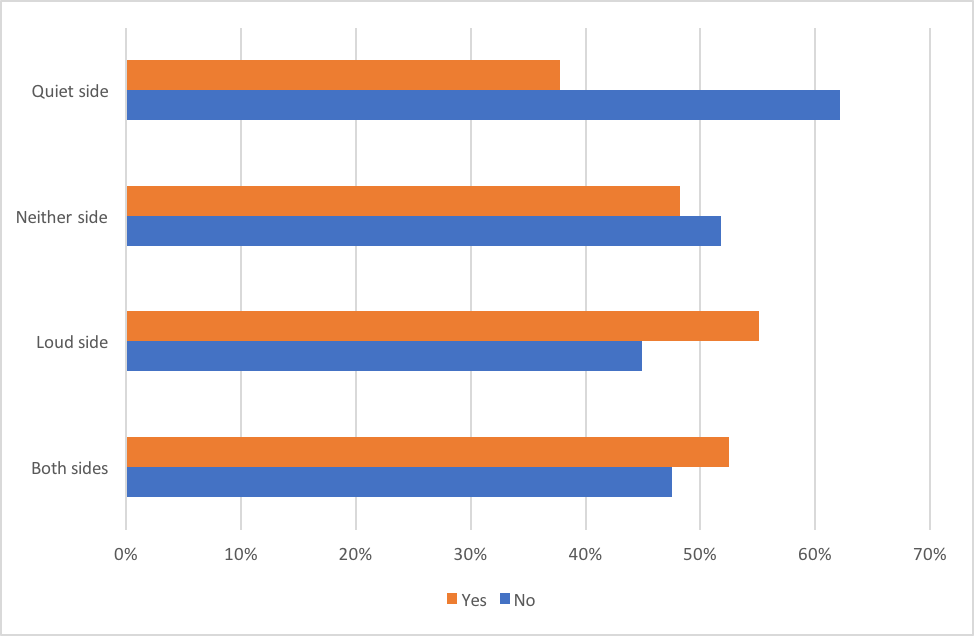
Figure 3. Answers to the question of socialization with people in another party, moderated by Usdan side preferences.
The survey also asked if students would date someone across the political aisle. 43.7 students responded “maybe,” 30 percent responded “no,” 26.3 percent responded “yes.” When divided by “Loud Side” and “Quiet Side,” however, the results look different: While the “Quiet Side” overwhelmingly said they wouldn’t date a political opponent, those who said they preferred neither side, the “Loud Side,” and both sides all said yes or maybe.
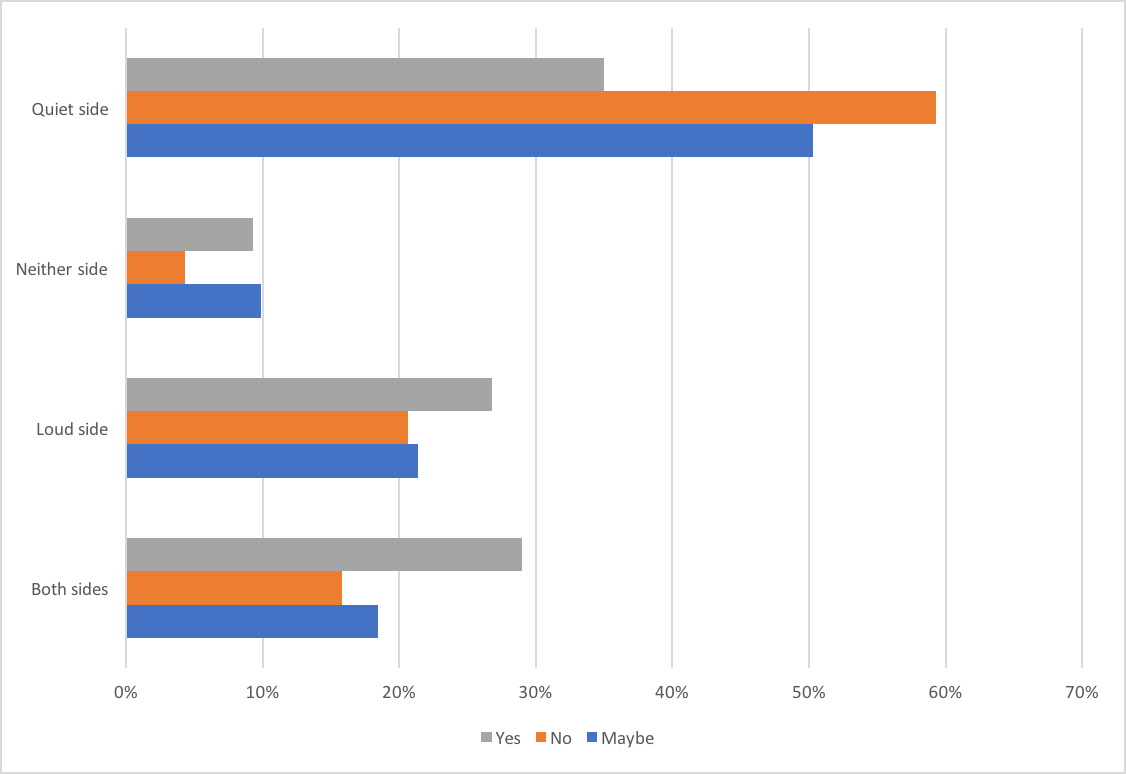
Figure 4. Responses to the question of whether students would date someone across the aisle, based on Usdan side preference.
Remaining survey data will be distributed to the wider student population likely by the end of the semester.
Kaye Dyja can be reached at kdyja@wesleyan.edu.
Comments are closed